DspEdu 2.1 is an Educational Software Package in DSP with Six Modules Covering 1. Linear Convolution of Two Finite Duration Sequences 2. Circular Convolution of Two Sequences 3. Linear Convolution from Circular Convolution 4. FFT and Sampling of Fourier Transforms 5. Spectral Analysis of Periodic Continuous Waveforms by FFT 6. FIR Filter Design by Windowing 7. IIR Filter Design by Analog to Discrete Transformation 8. Discrete-Time Transfer Function Pole-Zero Analysis.
This Site also contains a growing collection of Technical Articles written by Suresh Kumar K.S on topics in Electrical Engineering.
|
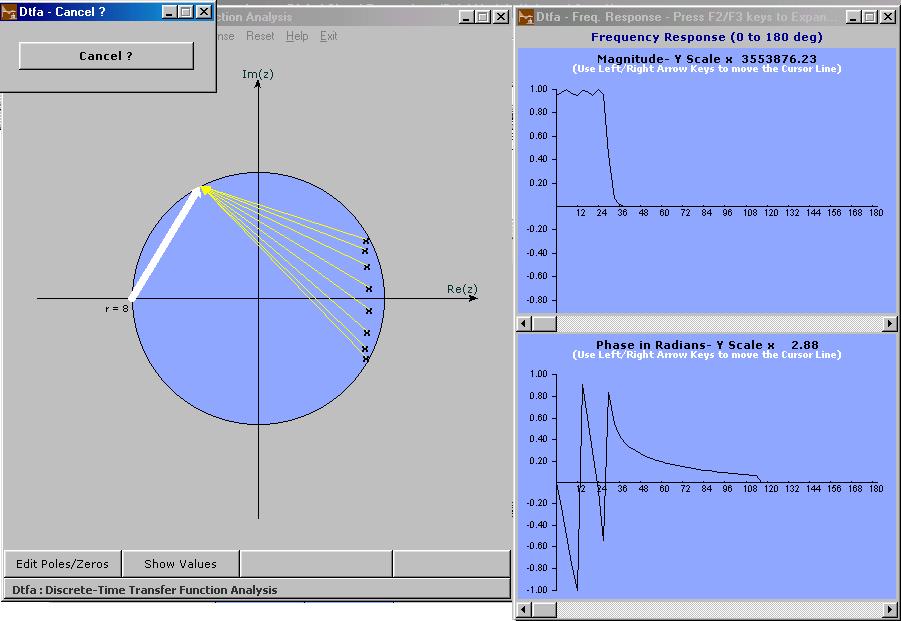
1. What does it do ? This module allows the user to interactively construct a Discrete-Time transfer function and study its frequency response and time-domain responses. An animation in the Pole-Zero diagram helps the user understand the impact of pole-zero locations on the frequency response of the system and illustrates the geometrical interpretation of frequency response clearly. 2. Main Window Components
2.1 The Pole-Zero Diagram Shows the Unit Circle in z-plane and marks the assigned poles by 'x' mark and assigned zeros by 'o' mark.The dotted circle can be compressed in diameter by 'Left Arrow' key and it can be expanded by 'Right Arrow' key . Similarly the dotted line can be rotated in counter-clock wise direction by 'Up Arrow' key and it can be rotated in clockwise direction by 'Down Arrow' key. These two degrees of freedom can be used to choose any point inside a circle of radius 1.5. Pressing 'Enter' key assigns a pole pair (pole if it is real) at the current point of intersection between the dotted circle and dotted line. Pressing 'Shift+Enter' assigns a zero pair (or a zero if it is real). Multiple poles and zeros can be assigned but the symbol used for marking poles and zeros will not reflect the multiplicity of poles and zeros. 2.2 'Done' Button Pressing this clears the dotted circle and dotted line and accepts the assigned poles and zeros for further processing. 2.3 'Show Values' Button Brings up a seperate text window showing the currently assigned poles and zeros.
2.4 'Edit Poles and Zeros' Button Brings up the dotted circle and line and opens the poles and zeros for editing or additions.Disables the 'Show Values' button and enables the 'Remove Poles and Zeros' button. 2.5 'Remove Poles and Zeros' Button Brings up a new window showing the currently assigned poles and zeros. Double-clicking on any entry will deassign it and will get unmarked in the Pole-Zero Diagram. 3. Menubar Items 3.1 File Menu 3.1.1 New Project Resets the poles and zeros and opens the Pole-Zero Diagram window for fresh assignment of poles and zeros. 3.1.2 Load Project Load a previously stored transfer function by opening a *.tfa file saved in an earlier session.The default directory will be '/Projects/tfa' 3.1.3 Save Project 3.1.4 Save Frequency Response Brings up a standard Windows Save Dialog box which opens into '/Projects/tfa' by default and shows *.txt as the default extension. The pole-zero data alongwith multiplicity and Frequency Response data etc.will be stored as an ascii file with selected name and 'txt' extension. The program assumes write permission in the chosen directory , overwrites with prompt and does not provide confirmation dialog. 3.1.5 Save Plots Brings up a standard Windows Save Dialog box which opens into '/Projects/tfa' by default and shows *.ps as the default extension.The three plots which currently appear in the three plot areas will be saved as three postscript files with selected names and 'ps' extension. The program assumes write permission in the chosen directory , overwrites with prompt and does not provide confirmation dialog. The frequence response plots and time response plots can not be open simultaneously. Hence 'save' opearation has to be repeated twice if both frequency response and time response plots have to be saved as postscript files. 3.2 'Frequency Response' Menu 3.2.1 Total System
Calculates frequency response data for the entire transfer function at 3 degree intervals in 0 to 180 degree range on the Unit Circle (this is the default) and plots the magnitude and angle in two plot areas in a new window which appears by the side of Pole-Zero Diagram. 3.2.2 Contribution Analysis
Brings up a new dialog window. The contribution of one pole pair (one pole if it is real) or one zero pair (one zero if it is real) or one pole pair plus zero pair can be seperately traced out in this mode. 3.2.3 Settings
Brings up a new dialog window. The default number of points in the frequency response calculation will be 60. This may lead to the plotted response failing to touch zero level when there is one or more zeros on the unit circle. It is possible to increase the number of points upto 360 by choosing the proper value in the pulldown box which appears in this window. However, the calculation and animation may become very slow. The entries in the pulldown box vary from 15 to 360. 3.2.3 Time Response Calculates the impulse response and step response of the system (provided the transfer function is causal and does not have multiple poles) and displays them in the companion window. A slider scale which appears at the bottom of this window can be used to change the number of points calculated in these responses and the update will be immediate. 3.4 Reset Cleans up the Pole-Zero diagram for a fresh start.3.5 Help -This page.3.6 Exit 4. Restrictions in the Evaluation Version The Module can be run only 15 times and each session will last only for 10 minutes.There are no feature limits. Page Updated
on 29th April 2004
|

